The Inflation Rate Isn’t Your Inflation
Written by Natalie Goretski, 3 July 2026
The ABS has reported that Australian CPI rose 4.0% in the twelve months to May 2026.
That’s the official inflation rate. It’s calculated as a weighted average of price changes across eight capital cities, covering a standardised basket of goods and services such as groceries, petrol, rent, healthcare and education.
But does that basket mirror our actual life?
What CPI Actually Measures — And What It Doesn’t
CPI measures how much it costs to consume things. What it clearly doesn’t measure is how much it costs to acquire things — specifically the assets that actually build wealth over time.
Although the ABS clearly documents this methodology, it is rarely discussed in everyday financial conversations.
ABS classifies land and existing dwellings as investment assets, not consumption goods. So their price movements sit entirely outside the CPI calculation.
Here’s what that really means in practice.
When the median Sydney dwelling price rises from $500,000 to $1.5 million over 15 years, none of that movement appears in the official inflation figure. Instead, the ABS measures the cost of newly built dwellings purchased by owner-occupiers, which largely reflects construction costs rather than the market value of existing homes. This number is obviously very different to what someone actually pays to enter the property market.
Housing accounts for around 22% of the CPI basket, yet the price of existing homes is excluded entirely.
The Numbers Missing from the Headlines
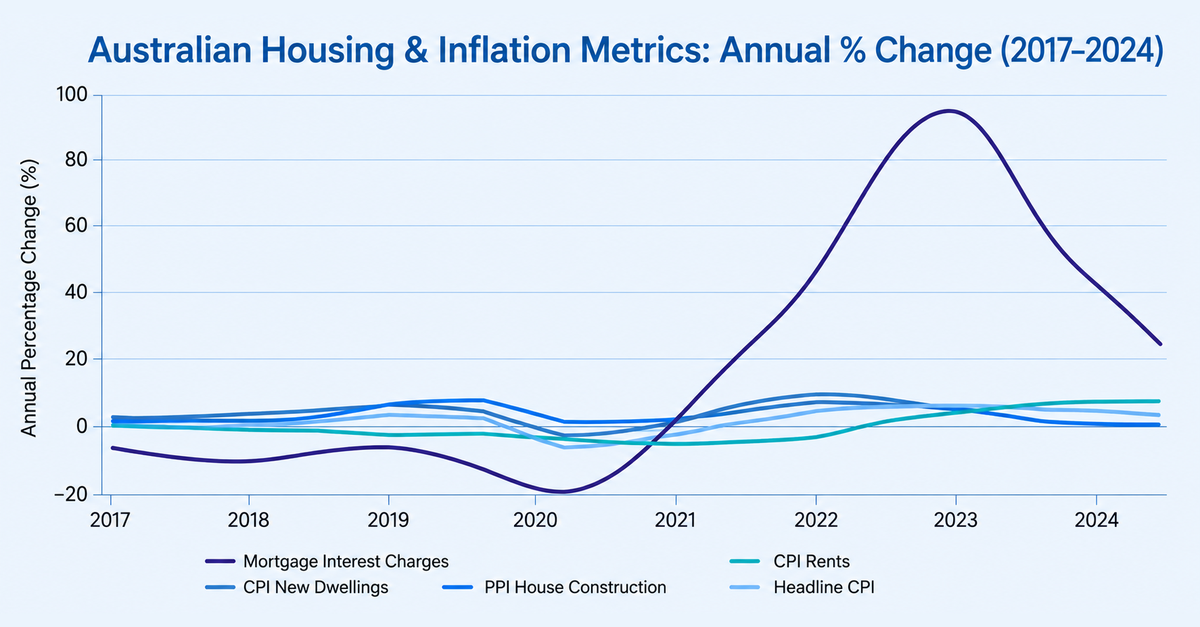
During the recent high-inflation period, the ABS’s own data told a story very different to the headline CPI figure.
The cost of new dwelling purchases by owner-occupiers rose by around 20% in a single 12-month period — clearly more than double the peak headline CPI of 7.8%. And mortgage interest charges, which arguably represent the real ongoing cost of housing for most Australian households, peaked at a staggering 91.6% annual increase in June 2023 and was still running at 26.5% a year later, in June 2024.
You can find that figure in the ABS’s Selected Living Cost Indexes but not in the headlines.
Meanwhile, wages grew by just 3.3%. The median dwelling value in Australia hit $920,100 in the most recent quarter.
The difference between official inflation and lived inflation is precisely why I believe every household should calculate its own personal inflation rate. We’ll come back to how to do that later.
CPI Is a Macroeconomic Tool — Not a Measure of Your Life
The CPI is designed as a macroeconomic tool for the RBA — to guide interest rate decisions at a national level.
It was never really designed to measure your personal cost of living.
But that distinction rarely gets explained. So most Australians probably assume the official inflation number reflects their reality — when it actually reflects an averaging of eight cities, dozens of household types, and a basket of goods that may have almost nothing to do with how they actually spend money.
Let’s consider three people living in Sydney today.
Person A rents a one-bedroom apartment, no children, uses public transport. Their personal inflation rate is probably close to the official figure — maybe slightly above given rental increases.
Person B is an owner-occupier with a fixed mortgage locked in two years ago, two kids in public school. Housing costs are relatively stable. Their personal inflation rate might actually be below CPI right now.
Person C is renting, has two kids in private school, holds private health insurance, and is still trying to save for a deposit. Secondary education rose 6.1% and private health insurance has risen consistently above CPI for years. Their personal inflation rate could easily be running at 7–9% — nearly double the official figure.
They all live in the same city and face the same official inflation rate, yet their financial reality is completely different.
The Wealth Transfer Nobody Is Talking About
Here is perhaps the deeper consequence of measuring inflation the way we do.
CPI measures consumer prices. It does not measure asset prices. And for many Australian households, the biggest driver of wealth outcomes has been the repricing of assets relative to income rather than wages or savings.
Housing, equities, and other scarce assets have appreciated far faster than wages over long periods. Someone who bought a Sydney home for around $150,000 in 1990 may now own an asset worth around $1.5 million — not through any active decision, but through three decades of monetary policy that pushed cheap credit into scarce assets, inflating their value regardless of what the owner did.
That price appreciation does not appear in CPI. It appears in net worth.
And by the time asset inflation does eventually filter through into consumer prices — via higher rents, higher construction costs, higher insurance premiums — the wealth transfer has already occurred. Those who owned assets before the surge captured the gain. Those still trying to enter the property market faced higher prices but didn’t benefit from the rise in property values.
The Number That Actually Tells You Whether You’re Moving Forward
Most high-income professionals track their income and savings. Few track the one number that shows whether they’re actually moving forward: their personal inflation rate.
Here’s a simple way to understand it.
Take the categories you actually spend money on — housing, food, transport, education, healthcare, insurance, childcare. Weight them by what percentage of your budget each represents. Apply the relevant price increase in the last 12 months for each category. The result is your personal inflation rate — the rate at which your cost of living is actually rising.
If your income or investment returns aren’t growing faster than your personal inflation rate, you’re not building wealth — you’re quietly losing purchasing power month by month.
This is probably why two people on identical salaries can have completely different financial outcomes — and why income alone is such a poor measure of financial health.
Your personal inflation rate is the minimum return your capital needs to generate just to stand still. Anything below that, and you’re almost certainly moving backwards — regardless of how your bank balance looks.
The Asset Price Problem Nobody Talks About
Even a well-constructed personal inflation rate doesn’t fully capture monetary expansion.
Over much of the period from the early 1990s to 2020, interest rates trended lower. Each cut made borrowing cheaper, which pushed more money into property and shares, which pushed prices higher. If you already owned those assets, your net worth quite likely grew regardless of what you did. If you were still trying to acquire them, the same mechanism was probably working against you every year.
It’s not fully reflected in CPI or salary growth, but you’ll almost certainly see its impact in your net worth over time.
So What Do You Do With This?
Three things, in order:
1. Calculate your personal inflation rate.
Not the government’s number — yours. Based on your actual spending, your actual housing situation, your actual life. It probably takes about an hour with your last twelve months of bank statements and the ABS category breakdowns.
2. Set your hurdle rate.
Your personal inflation rate is the minimum return your capital needs to generate just to stand still. Anything below that and you’re almost certainly moving backwards regardless of how your bank balance looks.
3. Measure your real position annually.
Net worth in nominal terms is really just a vanity metric. Net worth adjusted for your personal inflation rate — that’s the number that actually tells you whether last year was a good year financially or just a busy one.
The official inflation rate is a useful benchmark, but your personal inflation rate is the one that matters most.
One Question Before You Close This Tab
Right now, without checking any app or spreadsheet — could you answer this: Is your wealth growing or shrinking in real terms?
Not your salary. Not your savings balance. Your actual purchasing power position, after inflation, after tax, after the cost of the life you’re building.
If your answer is “I don’t really know” — you’re not failing.
You’re just working with a number that was never designed to measure your life.
Want to understand how to calculate your personal inflation rate and build a financial system around it?
Subscribe to my Newsletter for more exclusive stories, financial insights and tips to help you take control of the financial reality.
Natalie Goretski is the founder of iViser Academy, an online financial education platform helping high-income professionals build structured, AI-powered financial systems.
Sources:
ABS (2024). Measuring Owner-Occupied Housing in the Consumer Price Index. Australian Bureau of Statistics.
ABS Consumer Price Index, Australia, May 2026.
ABS Selected Living Cost Indexes, Australia, June 2023.
ABS Wage Price Index, March Quarter 2026.
ABS Residential Property Price Indexes, March Quarter 2026.
KPMG analysis of ABS National Accounts and Household Income and Wealth Survey, 2024–25.
Disclaimer: The information provided in this article, “The Inflation Rate Isn’t Your Inflation.”, is intended for educational and informational purposes only. It does not constitute financial advice, legal advice, or professional recommendations.
While every effort has been made to ensure the accuracy of the information at the time of publication, iViser Academy and the author make no guarantees of completeness, reliability, or applicability to your individual circumstances.
You should always consider your personal financial situation and, where necessary, seek independent advice from a licensed financial professional before making financial decisions. The author and iViser Academy accept no liability for any loss, damage, or consequences that may arise from reliance on the content of this guide. Use of this material implies acceptance of this disclaimer.